.svg)

Seasonal waste volume fluctuation isn’t just a challenge, it’s a reality that every business in Quebec faces, whether you’re running a bustling construction site, overseeing manufacturing operations, or managing distribution centers. The rhythms of the year dramatically impact how much waste accumulates, what types of material dominate your stream, and how often your containers need to be emptied. We’ve seen these patterns firsthand after performing over 100,000 mobile compactions across Quebec. It’s clear: navigating these annual waste patterns with a thoughtful, data-driven approach to volume mapping and flexible mobile compaction is essential for unlocking real savings and supporting sustainability on site.
Why Seasonal Waste Variation Matters for Quebec Businesses
- Spring construction booms spark surges in drywall, wood, and packaging waste.
- Summer heat accelerates organic spoilage and fills containers with compost much faster than winter.
- The fall harvest brings peaks in organic and yard waste at municipal and commercial sites.
- Holiday retail upticks, in late fall and winter, boost cardboard and recyclables by as much as 60-70%.
Understanding not just that these changes occur, but how, why, and when they happen across the year for your specific operations is the foundational first step toward optimizing container management, and that’s where seasonal waste variation, volume mapping, and annual waste patterns meet the power of mobile compaction.
Your Framework for Mapping Seasonal Waste Volume Fluctuations
At BinMasters Québec, we build every compaction strategy on solid data and lived operational reality. Here’s a tried-and-tested framework to map your waste volumes across the year and align compaction with your needs in real time.
1. Baseline Measurement: Documenting Your Annual Waste Patterns
- Track container fill rates month by month. Are your containers at capacity in May but only half full by February?
- Log waste categories by season. For example, is your spring construction waste different from your holiday packaging waste?
- Collect historical data. Even if it’s based on invoices or operator notes, compiling data from the last 2–3 years exposes your real seasonal ebb and flow.
We recommend setting up a shared waste logbook or digital spreadsheet. Don’t worry about perfection, consistency is what reveals your trends.
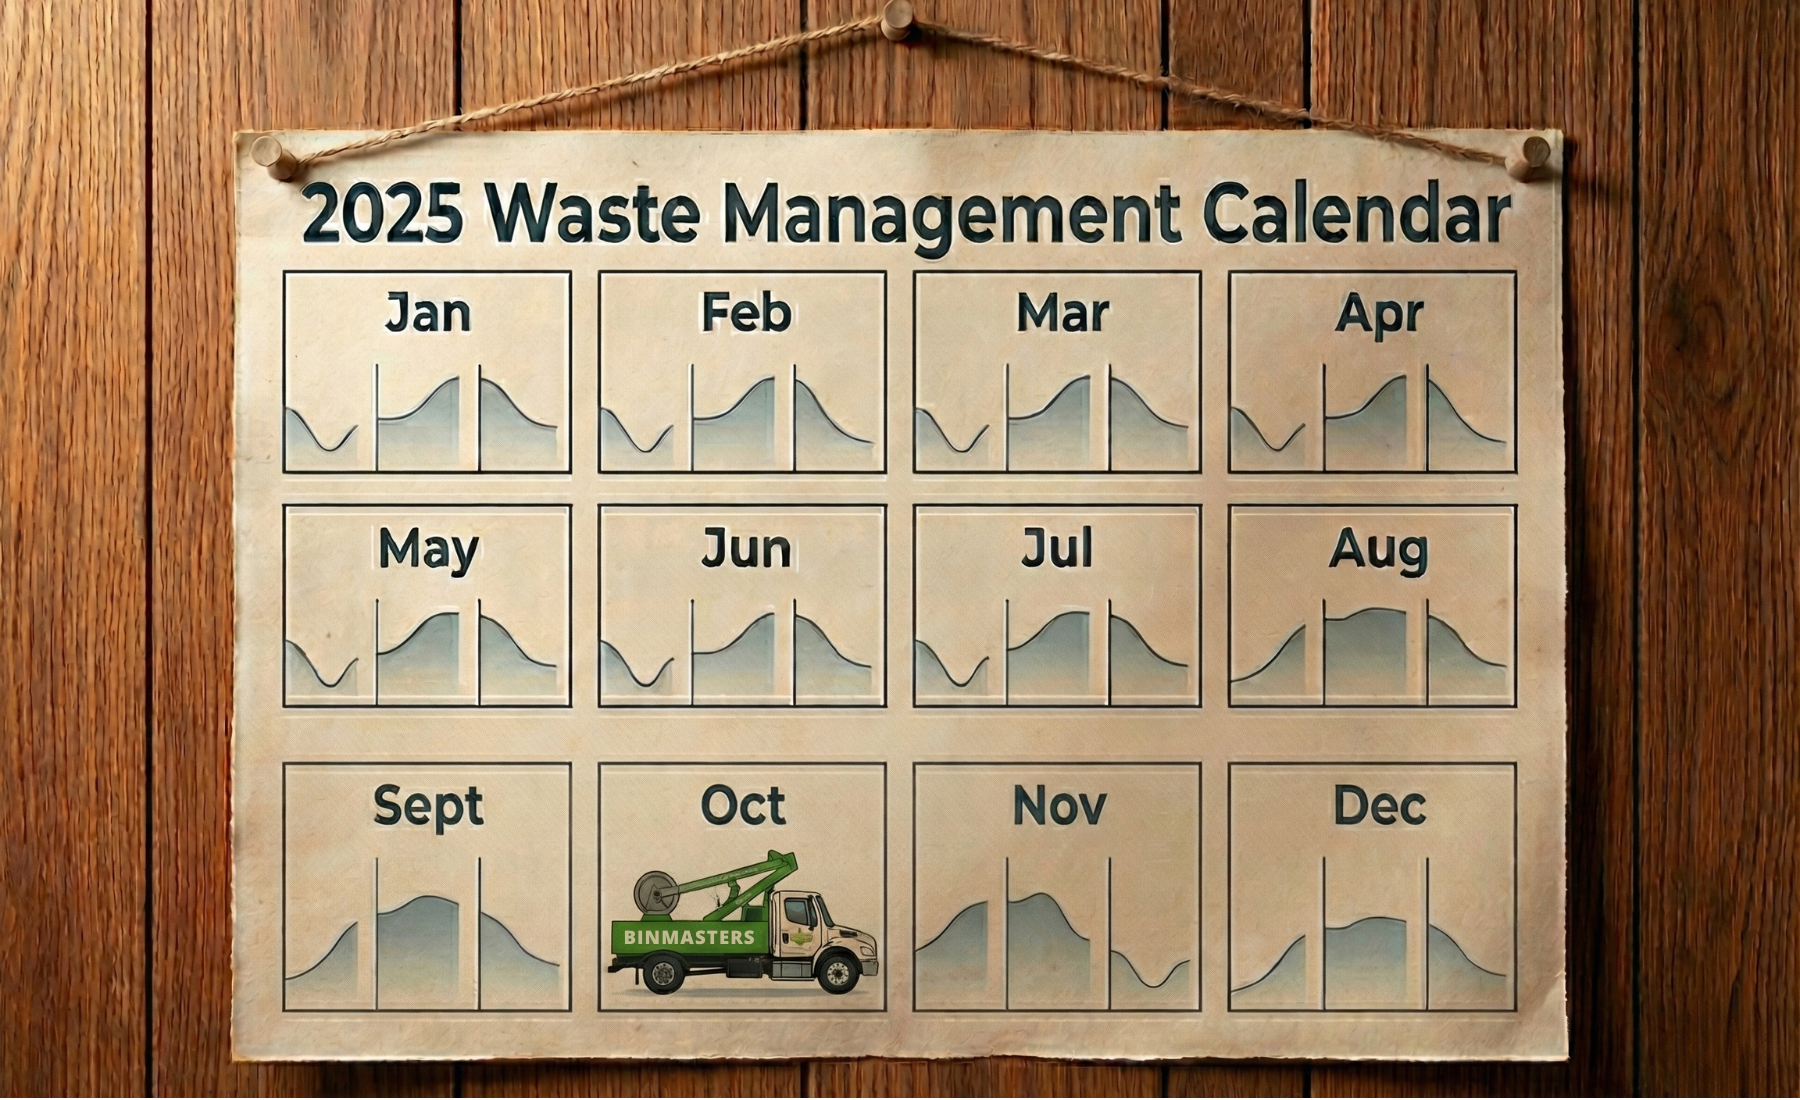
2. Volume Mapping: Visualizing and Analyzing Patterns
- Plot monthly data on a simple graph: container fill % or tonnage vs. time of year.
- Mark significant business events: project launches, harvest windows, holidays, municipal events, etc.
- Identify your high and low points. Where are the biggest spikes? What are your slow periods?
Annual waste patterns become much clearer in a visual format. Your team can quickly spot, for instance, that July and August always bring a 40% jump in compostables, or that every January has a persistent surge in recyclables due to post-holiday returns.
3. Waste Stream Segregation and Quantification
Segment your waste data by material type:
- Organic/Compost
- Construction and demolition
- Cardboard and other recyclables
- Metals and mixed materials
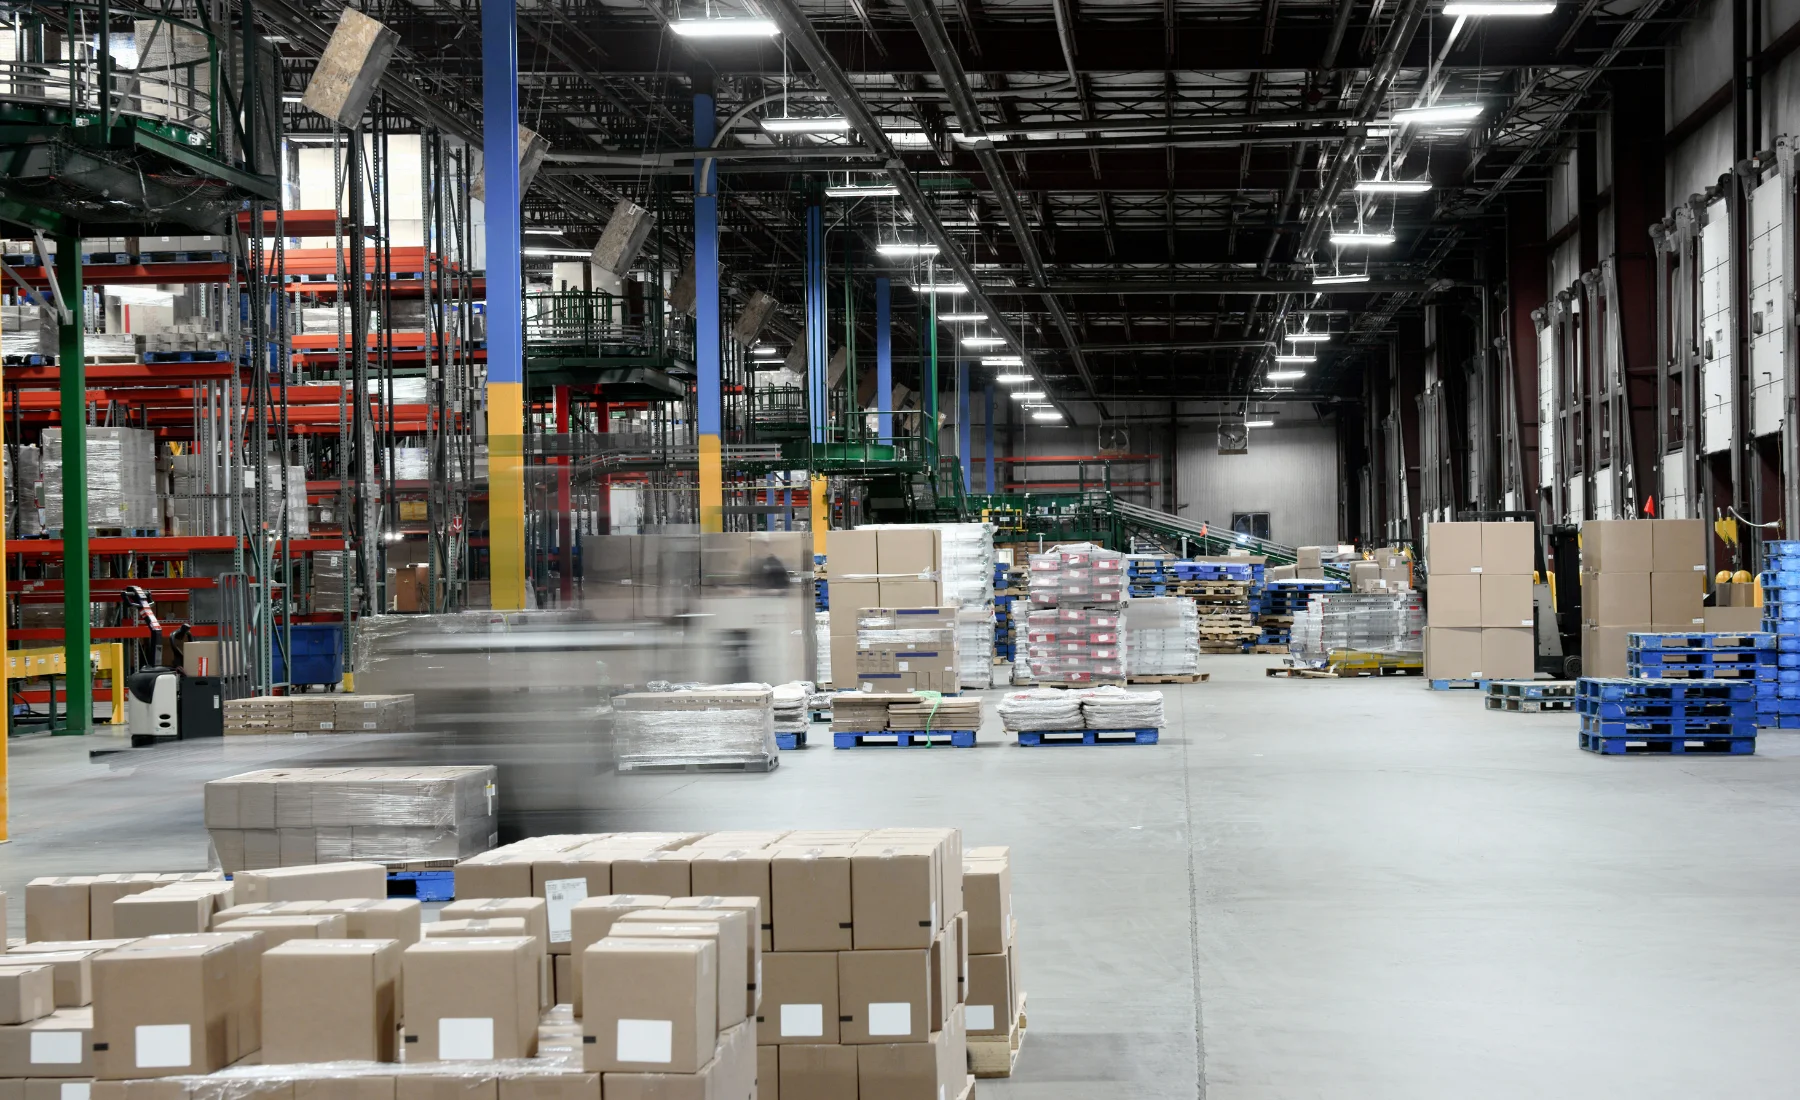
This helps you pinpoint which part of your operation triggers seasonal spikes. For example, a distribution center may see packaging waste multiplying before the winter freeze or at back-to-school season, while construction sites burst with debris at project closeout.
Turning Insights into Action: Year-Round Mobile Compaction Scheduling
Once your data tells the story, it’s time to translate volume mapping into a practical compaction roadmap. Here’s how we help businesses across Quebec get ahead of their changing needs:
Proactive Compaction Scheduling
- High-Season Planning: Book extra compaction visits at expected peak months (e.g., set up biweekly rather than monthly service during summer or after major commercial events).
- On-Demand Flexibility: Use mobile compaction to respond to short-term project surges: a festival, special event, or demolition phase.
- Low-Season Efficiency: Scale compaction frequency back after mapping periods with lower container fill rates. Why pay for empties when you can save by matching service to need?
Adapting to Your Industry: Seasonal Examples
- Municipal/Public Works: Fall leaf collection and spring cleanups are predictable high-water marks. Mapping these allows cities to coordinate mobile compaction for all eco-centers and public drop-off locations simultaneously.
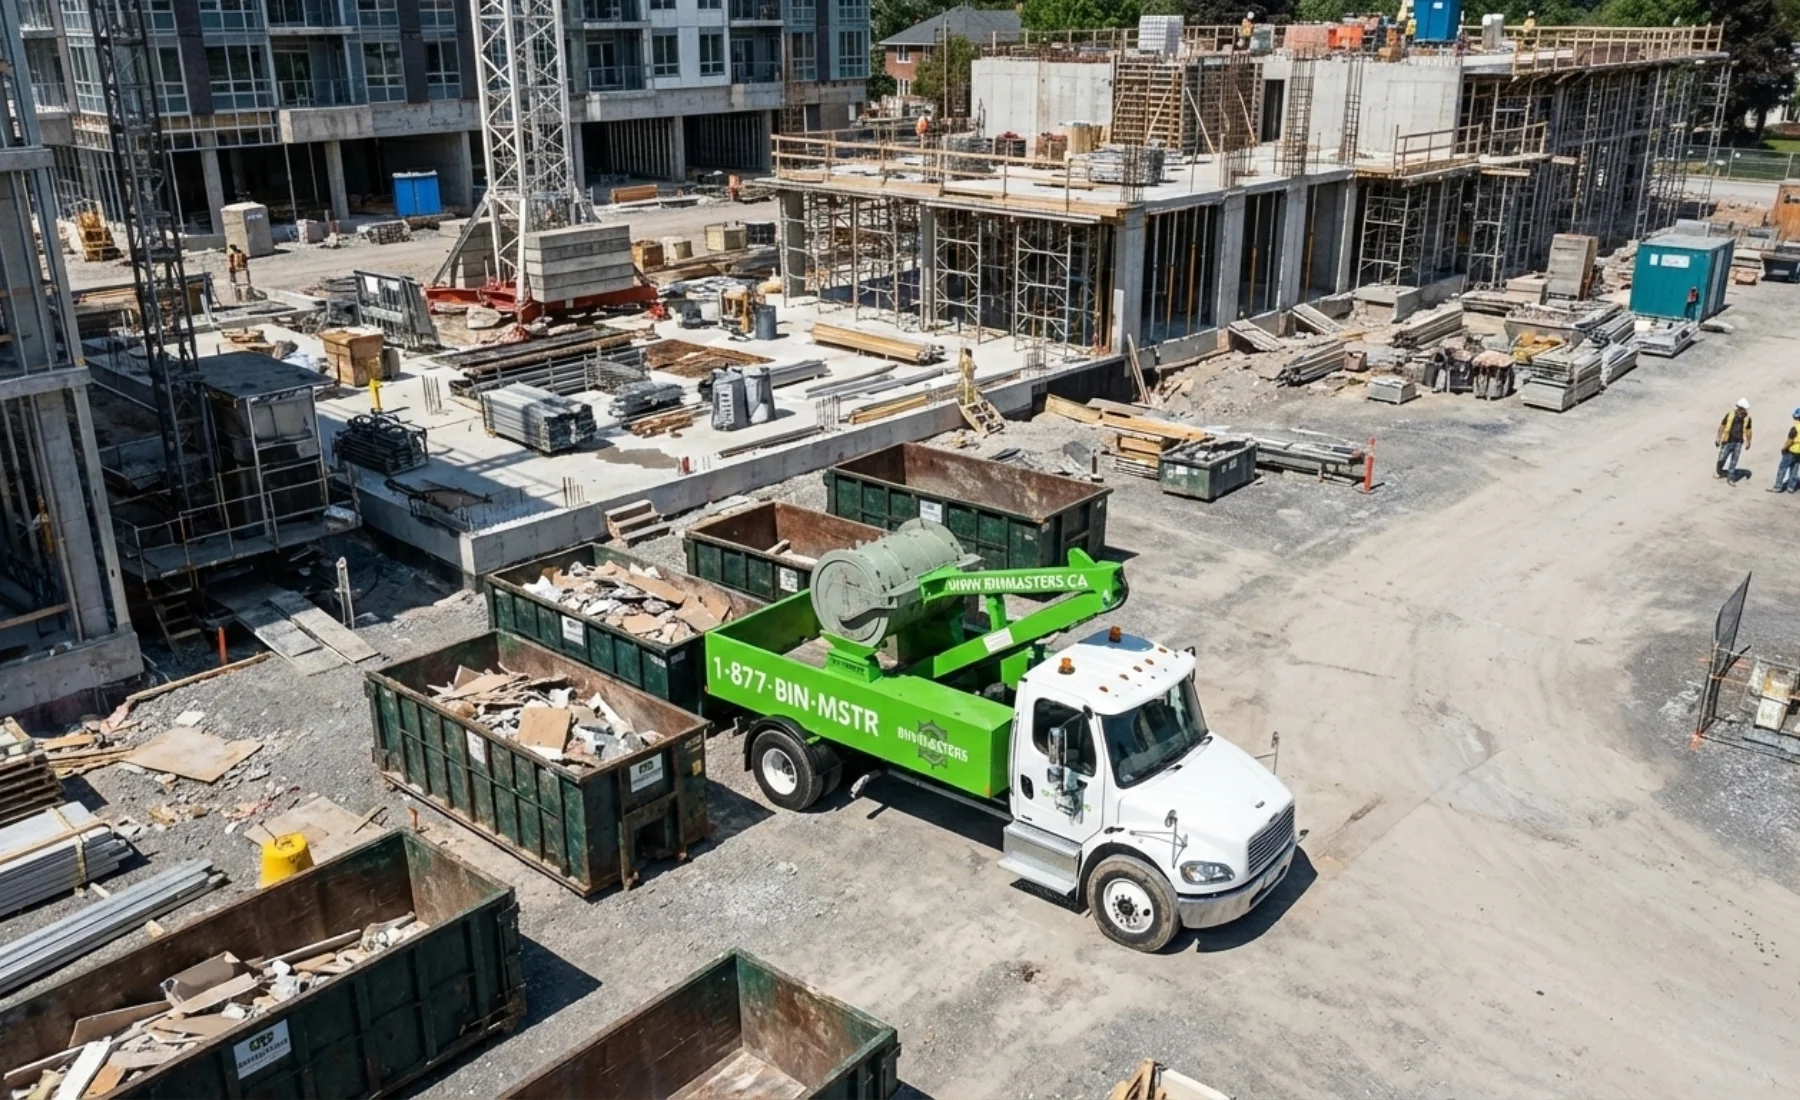
- Construction: Plotting waste volume across project timelines reveals that demobilization (site cleanup) creates short, massive spikes. A targeted compaction blitz can slash container rotations during this crunch.
- Manufacturing/Distribution: Quarterly cycle counts, product launches, or seasonal stocking can create irregular peaks. Mapping those enables pre-emptive scheduling, avoiding emergency pickups.
Optimizing the Compaction Formula
- Set baseline compaction intervals based on "normal" months, then adjust upward for seasonal surges.
- Adjust container size or type if mapping shows a major waste composition change (e.g., wood pallets in spring, compost in high summer).
- Communicate with your compaction partner. Sharing your mapped data helps your provider (like BinMasters Québec) recommend the perfect service rhythm for every period.
Remember, mobile compaction is most effective when it’s truly mobile, moving with your needs, at your schedule, without long-term commitments or unneeded costs. That’s why smarter volume mapping always leads to bigger savings.
Environmental and Financial Impact: Why This Matters
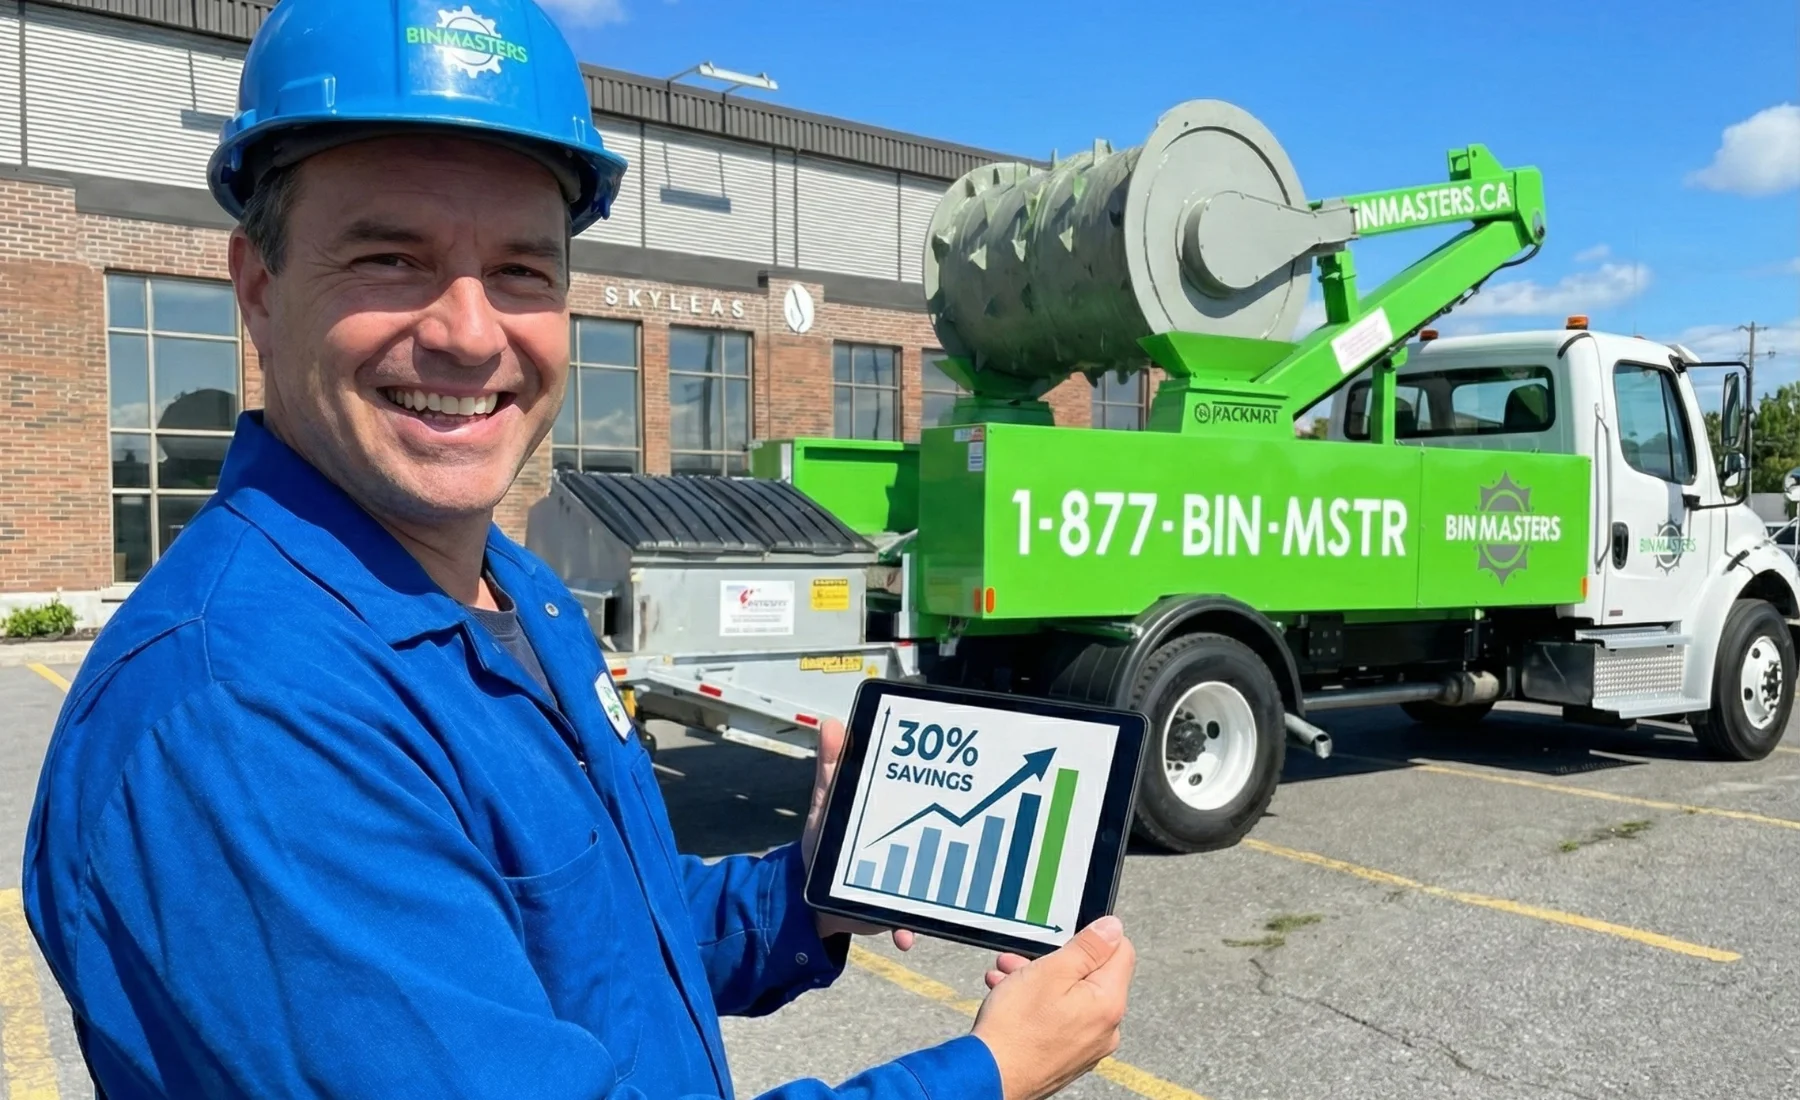
- Less frequent container pickups: Our experience shows compaction can reduce container volumes by an average of 60%, and by up to 70% for recyclables, directly slashing transport costs and lowering carbon emissions.
- Prevents container overflow and site mess: Seasonal mapping ensures you’re never blindsided by "sudden" waste waves, keeping operations safe and compliant.
- Proves sustainability in action: Showing mapped seasonal reductions in waste transport and improved recycling rates builds credibility with regulators, clients, and the community.
- Maximizes every dollar spent on waste management: Why pay to truck air? Compaction schedules linked to real volume mapping mean every pickup counts.
Getting Started: A Simple Checklist for Your Team
- Designate a team member to maintain your waste volume log.
- Set a recurring reminder, monthly is usually best, to update and review data.
- Work with your compaction provider to analyze your annual patterns and develop a flexible compaction schedule.
- After your first year, revisit your mapping: what worked, what can improve?
The Real-World Results of Seasonal Waste Volume Mapping
After supporting clients across Quebec’s diverse industries, we can say: the businesses that take charge of their annual waste patterns with robust volume mapping and strategic scheduling see immense financial, operational, and environmental gains. They not only cut container pickups by 40% or more during peak periods, but also set a visible example of eco-intelligent waste management.
If you’re ready to break the cycle of surprise overflows and unpredictable costs, start mapping your seasonal waste variation today, and discover how mobile compaction makes waste management simple, efficient, and future-focused for every month of the year.
For expert, no-obligation advice tailored to your facility, or to schedule your first compaction free, visit BinMasters Québec. See your annual patterns—then act on them.